BackRoll Tests Retirement Plans With Centuries of Inflation-Adjusted Market Data
Retirement Planning Raph Antoine 690 reads
BackRoll lets investors test portfolios and withdrawal plans in their home currency, while showing the limits of historical data and modeled crises.
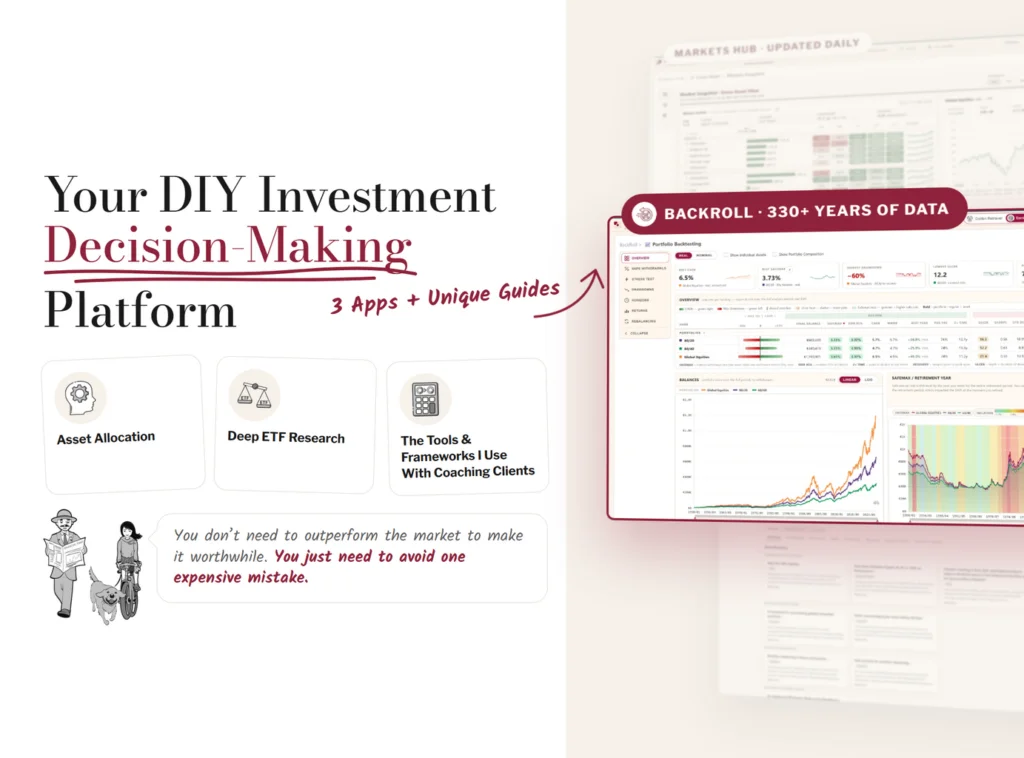
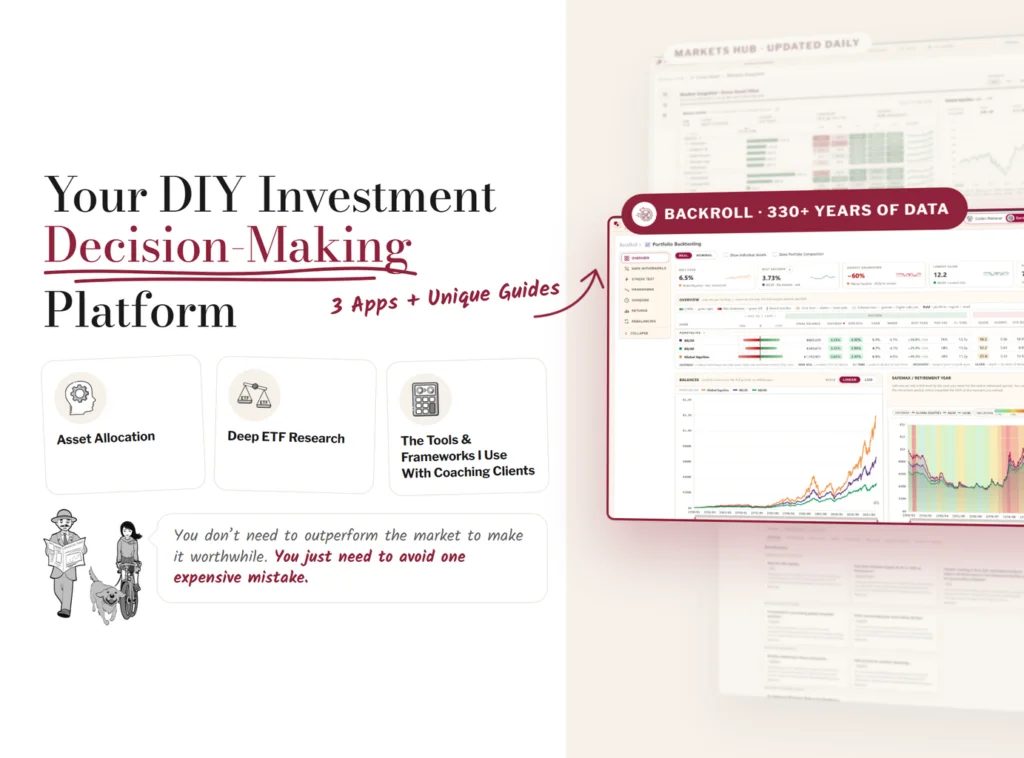
A retirement plan can look comfortable in a spreadsheet and still struggle when inflation or a bad run of returns arrives early. BackRoll is designed to help long-term investors examine that risk using historical market data, local inflation and their own currency. Its central value is stress testing: it can show where a plan might have faltered in the past, but it cannot tell anyone what markets will do next.
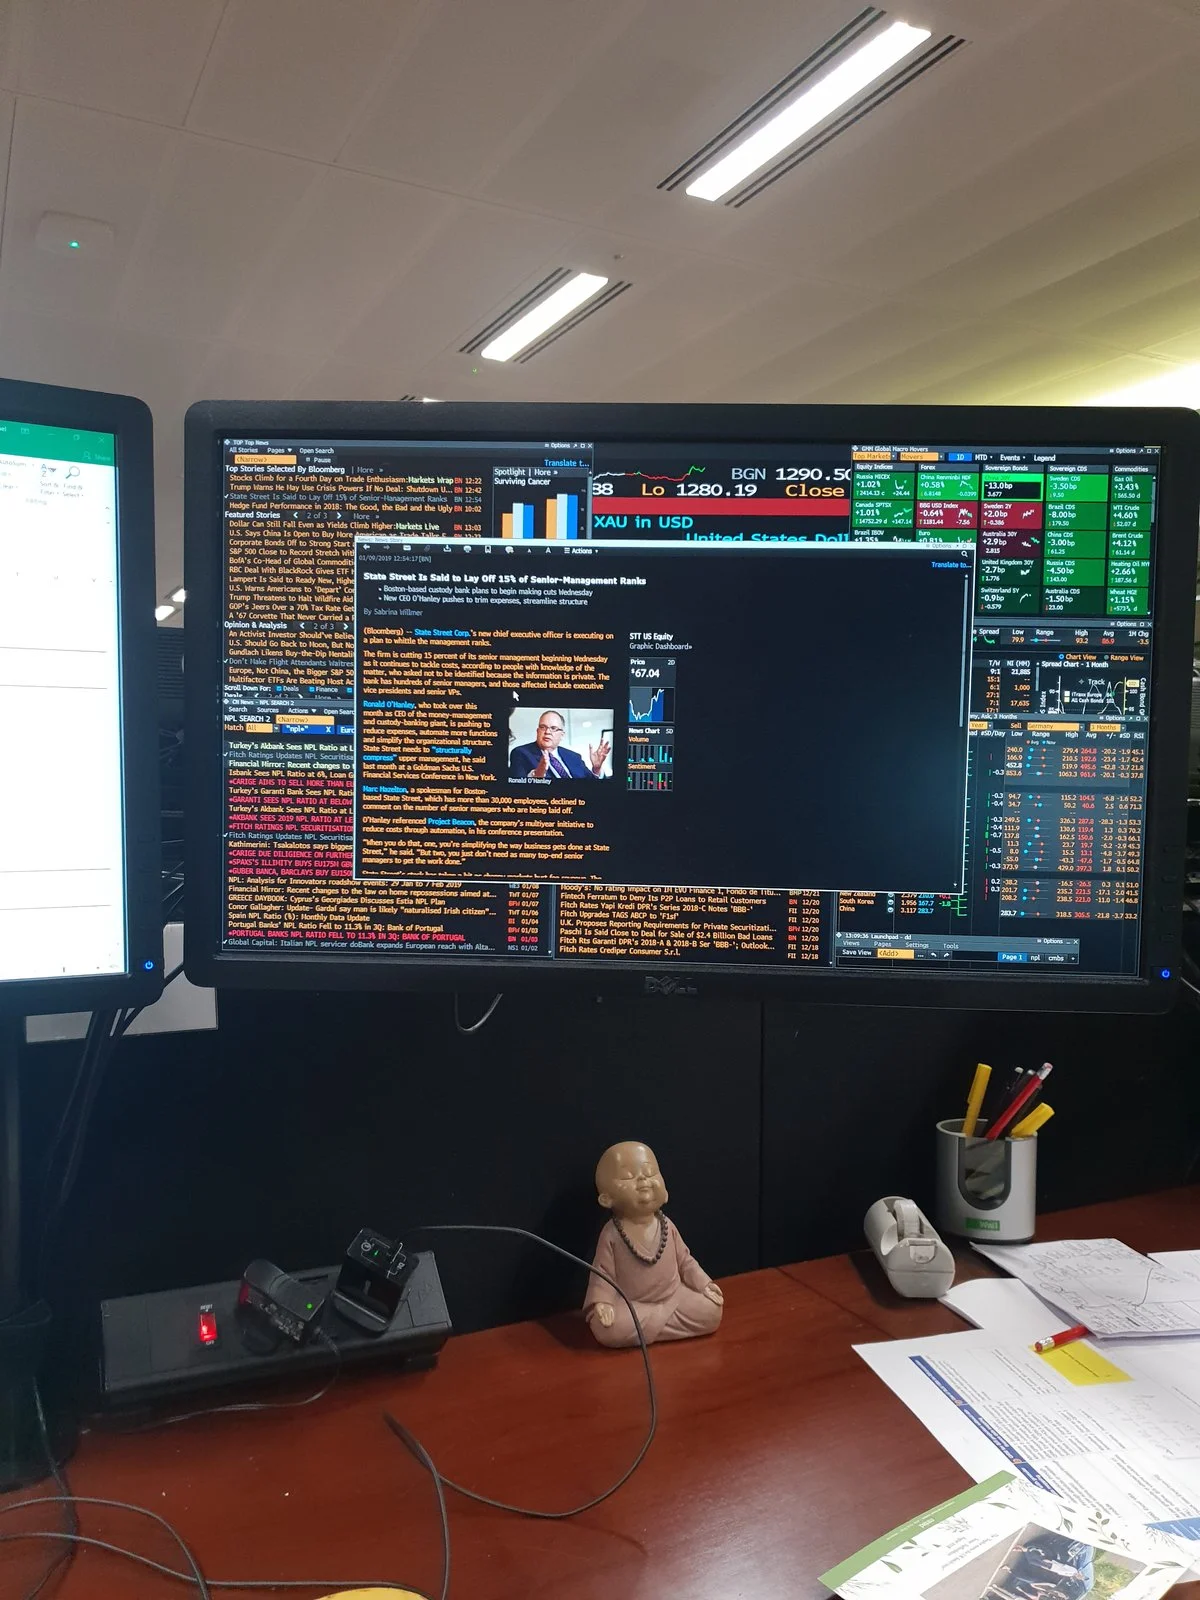
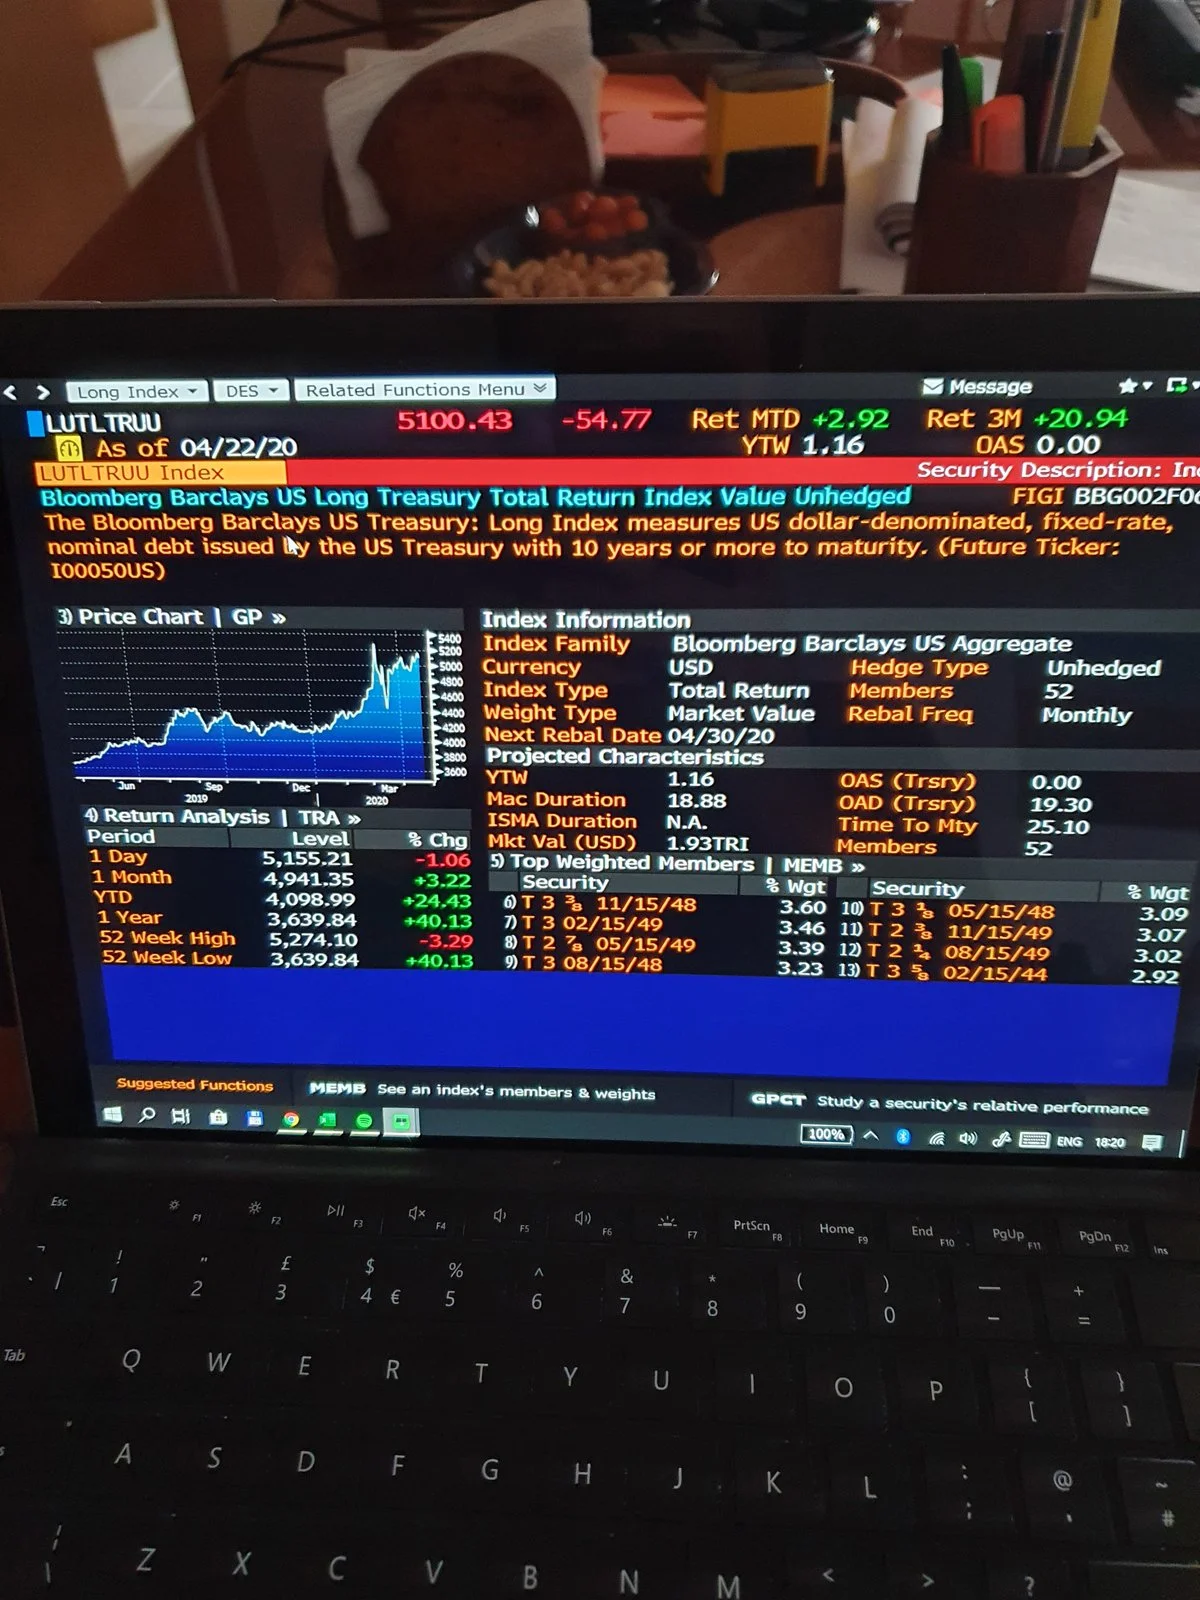
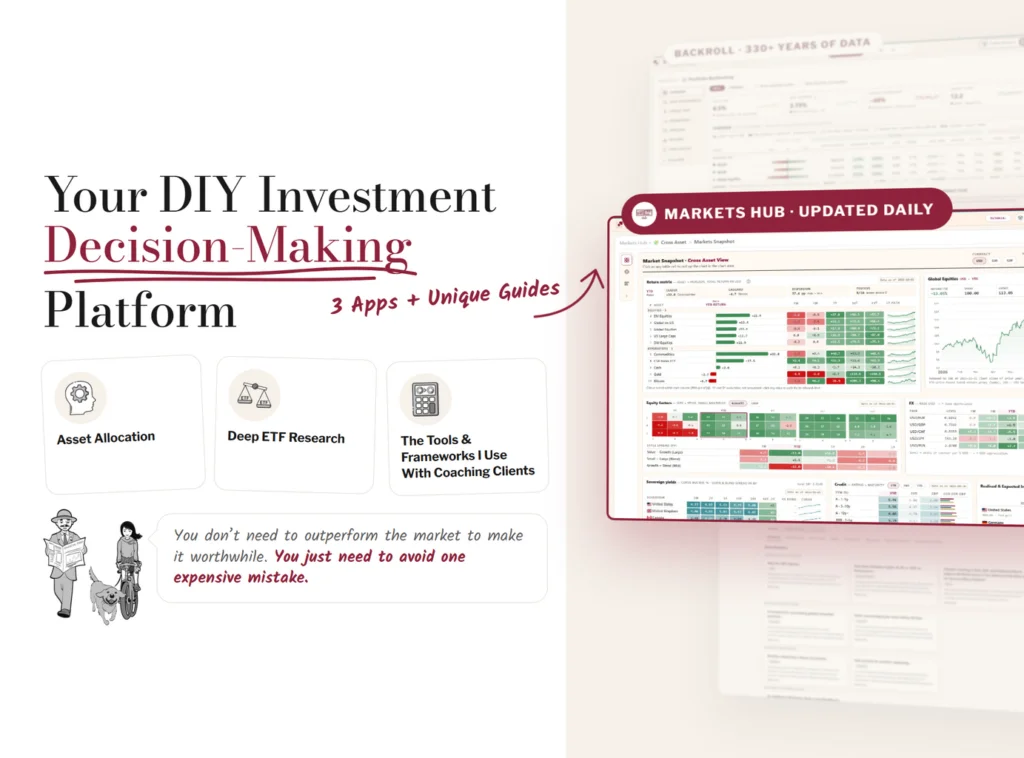
The tool is part of a broader research service built for investors who have limited access to a Bloomberg Terminal and want portfolio analysis geared to life outside the United States. Its creator says a long-term investor may need only a small set of functions from a large financial data platform: test how a portfolio compounds over time, see current market conditions, review long-run assumptions and track household wealth. BackRoll addresses the first of those needs.
Testing a retirement plan in local terms
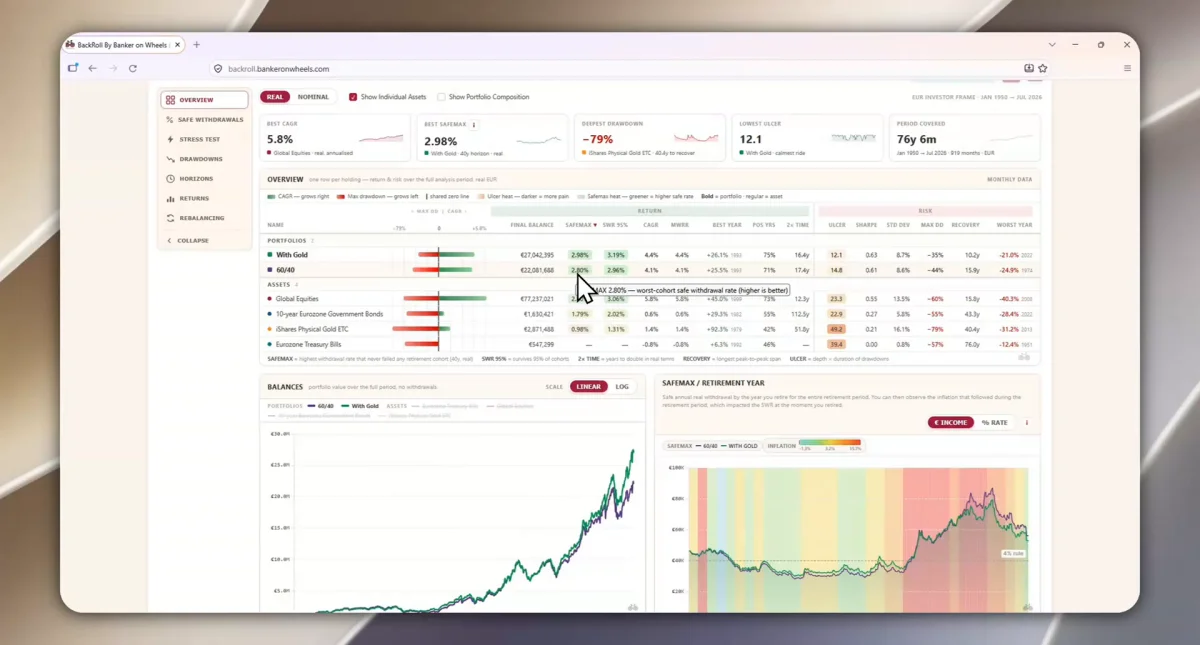
The demo follows a hypothetical eurozone retiree with €1 million invested over a 40-year retirement. In the historical backtest, the worst starting point for retirement was in the 1960s, when inflation was high. A 60/40 portfolio produced a worst-start safe withdrawal rate, or SAFEMAX, of 2.8%. Adding gold raised that result to 2.98%.
Those figures translate to roughly €28,000 a year for the 60/40 portfolio before considering the assumptions built into the test. They are historical results for a specific portfolio and period, not a spending recommendation or a promise that a future retiree could safely withdraw the same share. The demonstration also shows why sequence matters: identical portfolios can produce very different retirement experiences depending on when withdrawals begin and what markets do early in the plan.
BackRoll works with more than 330 years of monthly data, using Finaeon (Global Financial Data) histories alongside synthetic series. It is aimed especially at investors in the eurozone, the UK, Switzerland, Japan and Poland, though users in the United States, Singapore and the Middle East are also welcome. Results can be shown in the selected home currency and adjusted for that country’s inflation.
Long windows, local assumptions and familiar portfolios
Users can choose among nine home countries. That selection sets the currency, inflation measure and risk-free rate used in the analysis. The UK has the longest historical record. The eurozone series is synthetic from 1950, since the euro itself did not exist throughout that period; it provides a way to examine what a Belgian investor might have experienced across older market conditions. Core or Conservative inflation settings are available for the eurozone.
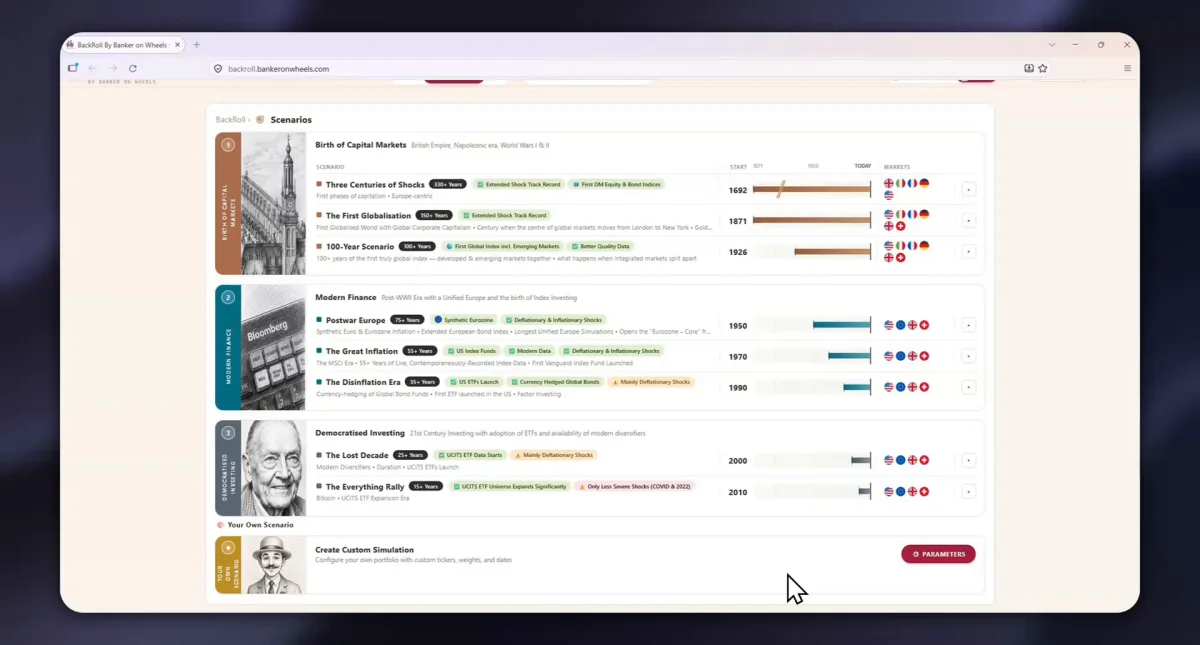
The starting point can come from eight prepared scenarios spanning distinct periods: Three Centuries of Shocks (1692), The First Globalisation (1871), the 100-Year Scenario (1926), Postwar Europe (1950), The Great Inflation (1970), The Disinflation Era (1990), The Lost Decade (2000) and The Everything Rally (2010). The reasoning is straightforward: a plan tested only against the recent past may be shaped by a period of unusually strong returns. A longer record offers a broader set of conditions, though it still cannot encompass every future possibility.

Investors can build portfolios from broad asset classes, with long Finaeon histories linked to the exchange-traded fund they might buy today. For example, the UK equity history begins in 1692 and connects to an iShares FTSE 100 UCITS ETF. The stated focus is on core holdings rather than a long list of niche assets, following a “quality over quantity” approach intended to keep analysis readable.

There are also starting configurations based on familiar approaches, including Bogleheads, Vanguard LifeStrategy, Ray Dalio’s All Weather, Harry Browne’s Permanent Portfolio, Buffett’s 90/10, Rick Ferri’s Core Four and the Bengen 4% rule. Users can save their own configurations in folders. The tool’s settings include rebalancing, costs, contributions, leverage and additional income such as a pension, rent or proceeds from selling a property. A missing asset can be requested by sending its ISIN and a comment; new assets are added monthly, and uploading a user’s own series is planned.

What the analysis can show
BackRoll’s retirement features include success curves, comparisons across asset allocations and a success map. Other views examine the impact of past crises in nominal and inflation-adjusted terms, drawdowns, rolling portfolio balances and holding periods. The demo reports that 18% of one-year periods were negative, while almost none of the 10-year periods were negative in nominal terms. Once inflation is included, the picture changes. That distinction matters for savers: a balance that rises in currency terms can still lose purchasing power.

Users can also review real-return distributions and the potential cost of rebalancing, if they include a rebalancing cost in their settings. These views help explain how assumptions affect results. They do not remove the uncertainty in real household spending, future inflation or market returns.

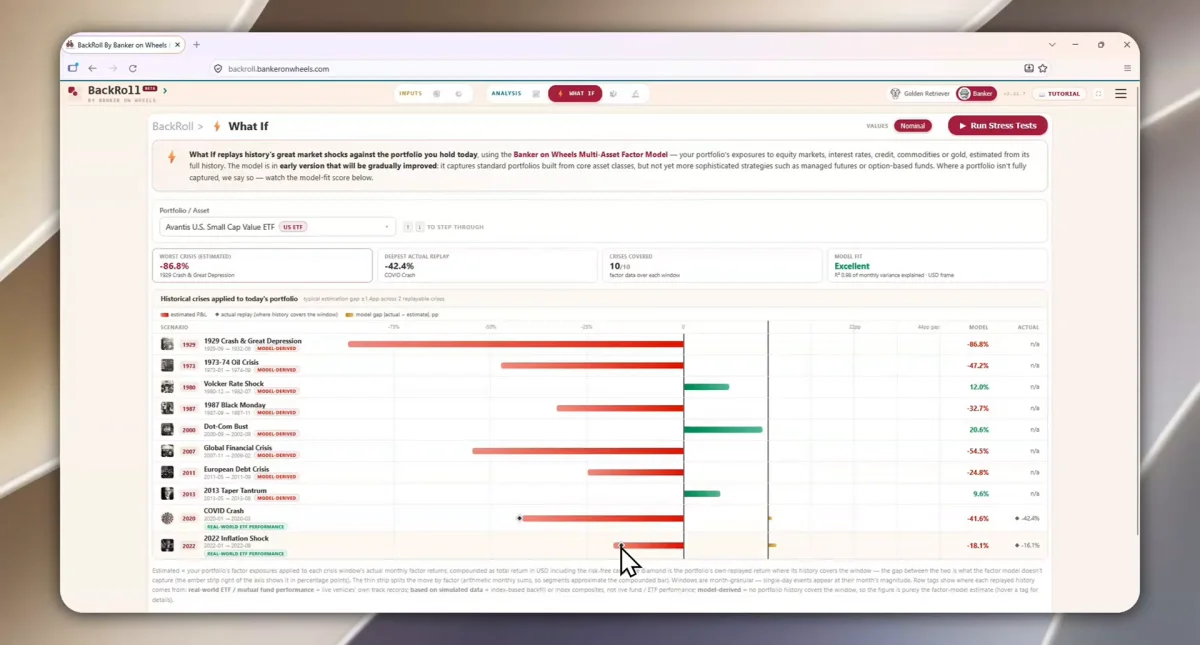
A separate “What If” simulator estimates how a newer fund or a portfolio without a long trading record might have behaved in older crises. Its example is the Avantis U.S. Small Cap Value ETF, launched in 2019. The model estimates a loss of 86.8% in the 1929 crash and 54.5% in the global financial crisis, compared with the fund’s actual 42.4% loss during COVID. These earlier figures are model estimates, not observed results for a fund that did not yet exist.

The simulator uses the Banker on Wheels Multi-Asset Factor Model, which covers factors including equities, small caps, value, rates, credit, commodities and gold. It can be applied to a portfolio, including one built outside the United States, rather than only to a single fund. An advanced Factor X-ray module examines equity and non-equity factors, including term premia in the EU, Japan, the UK and Switzerland. A Monte Carlo module offers another way to explore uncertainty, recognizing that recorded history has happened only once.
Read the results with their limits in mind
Backtesting is a way to probe a plan, not a forecasting engine. The data is monthly, so a sharp event that begins and ends within one month may barely register; daily market moves are not captured. That makes the tool suited to long-term planning and poorly suited to day trading.
Some long histories use chain-linked data. For periods before a live fund existed, the record may be based on an index, and costs or tracking differences are approximations. The eurozone’s pre-euro history is synthetic. The What If module is an early version intended for portfolios built from core asset classes, and its model-fit score helps indicate how well the model represents a given case. These details are part of the result: a precise-looking chart is only as useful as the data and assumptions behind it.
The development process began with manually coding the tool in Python and mapping data sources for evidence-based portfolios. The team created synthetic and hedged series, added local inflation and later partnered with Finaeon for long-term data. The interface includes tutorials and two display modes: a simpler “Golden Retriever” setting and a more detailed “Banker” setting.
Who may find it useful
BackRoll is aimed at people outside the United States who want to compare how allocation affects compounding and drawdowns, or who are planning to draw income from a portfolio. It may help someone weighing a basic 60/40 mix against options such as adding gold, changing bond duration, hedging currency or including factor exposures. Its local currency and inflation settings address a practical gap in many free tools, which tend to present results in dollars for American investors.
The service runs in a browser on a computer or phone, with no app installation required. At the time described, the presale was open through 15 November 2026, with access beginning 16 November as part of Premium Research. Four components were described as live and continuously updated: Premium Guides, BackRoll, Markets Hub, and Library plus Toolbox. A Portfolio and Wealth Tracker was in development for 2027/28 as a separate add-on, included with Lifetime.
The useful question isn’t whether a backtest can identify the perfect portfolio. It can’t. The better question is whether a plan still makes sense when tested against inflation, difficult starting periods and assumptions close to the investor’s own circumstances. BackRoll is built to make that examination more concrete, while leaving the future uncertain.