Markets Hub Demo: Long-Term Returns, Bond Yields and Cash-Flow Planning
Retirement Planning Raph Antoine 323 reads
A daily-updated market monitor brings long-term return assumptions, bond data, inflation and ETF ladders into one place for financial planning.
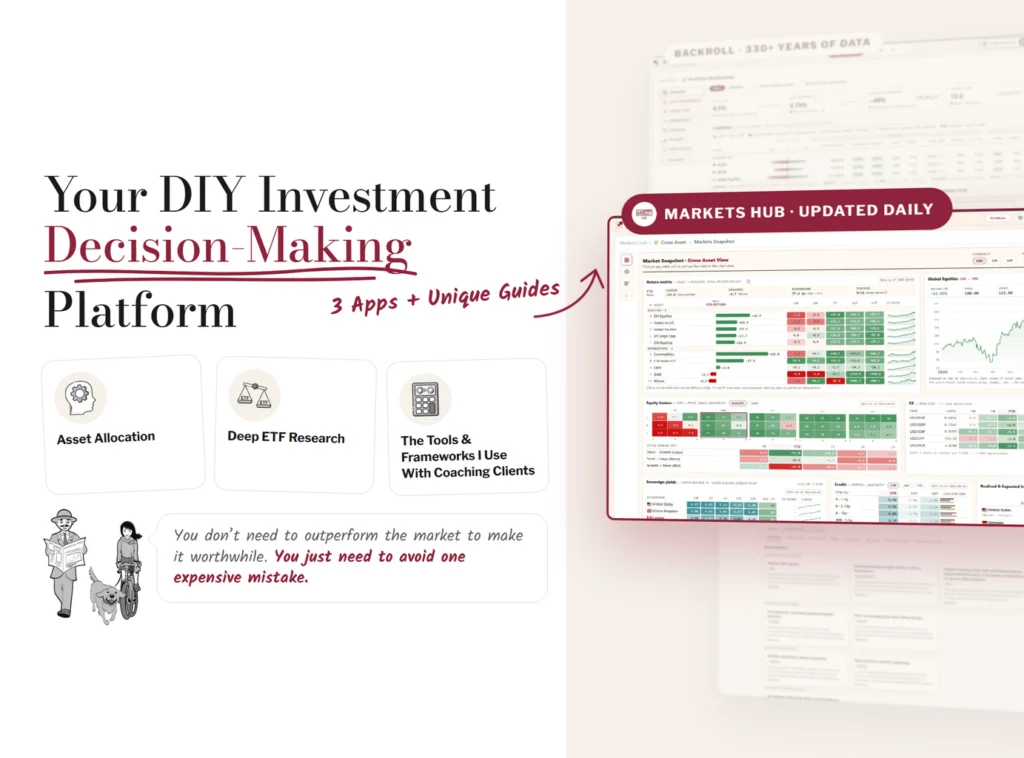
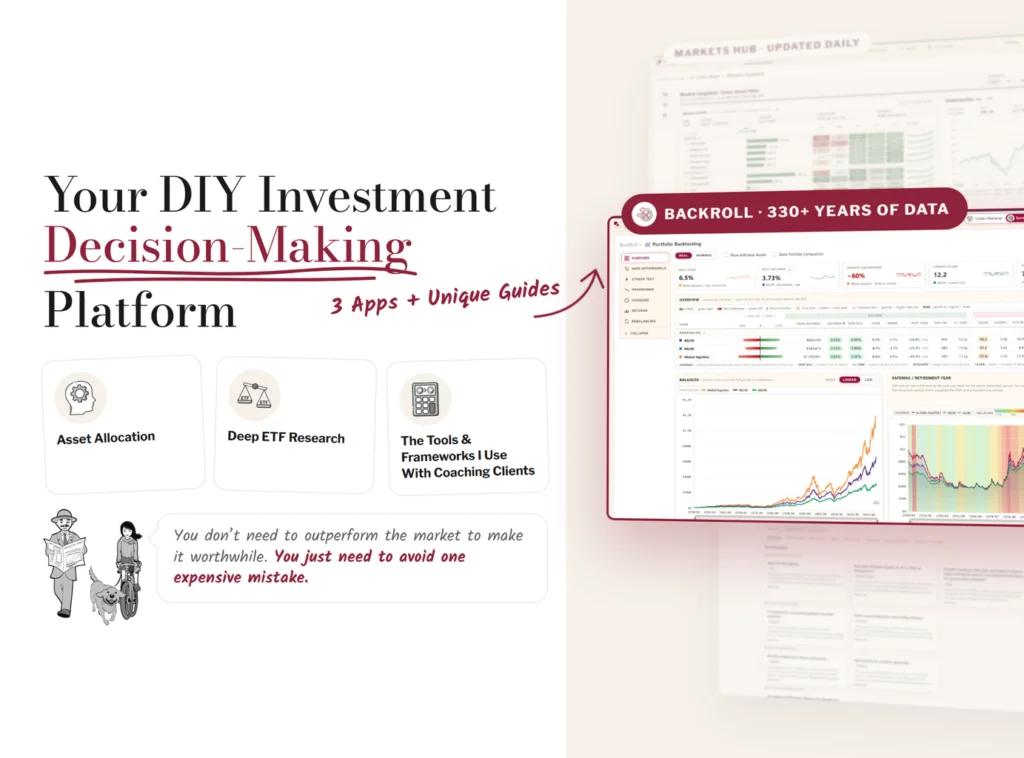
For long-term investors, the useful question isn’t what markets will do next week. It’s what today’s yields, valuations and currency costs can tell you about planning over many years. Markets Hub gathers those signals in one place, with daily updates and views in multiple currencies. It’s designed to support financial planning and help investors stay grounded through market swings, not to forecast prices or guide short-term trading.
The tool is the second pillar of Banker on Wheels Premium, following BackRoll, a backtesting tool. Its central idea is straightforward: shorter-term market moves are hard to predict, while some long-run return drivers are easier to observe. Equities derive much of their long-term return from company earnings growth and dividends. For bonds, starting yields and the effect of currency hedging account for much of the return. Those inputs can inform a plan, but they can’t promise a result.
One view for planning, with two levels of detail
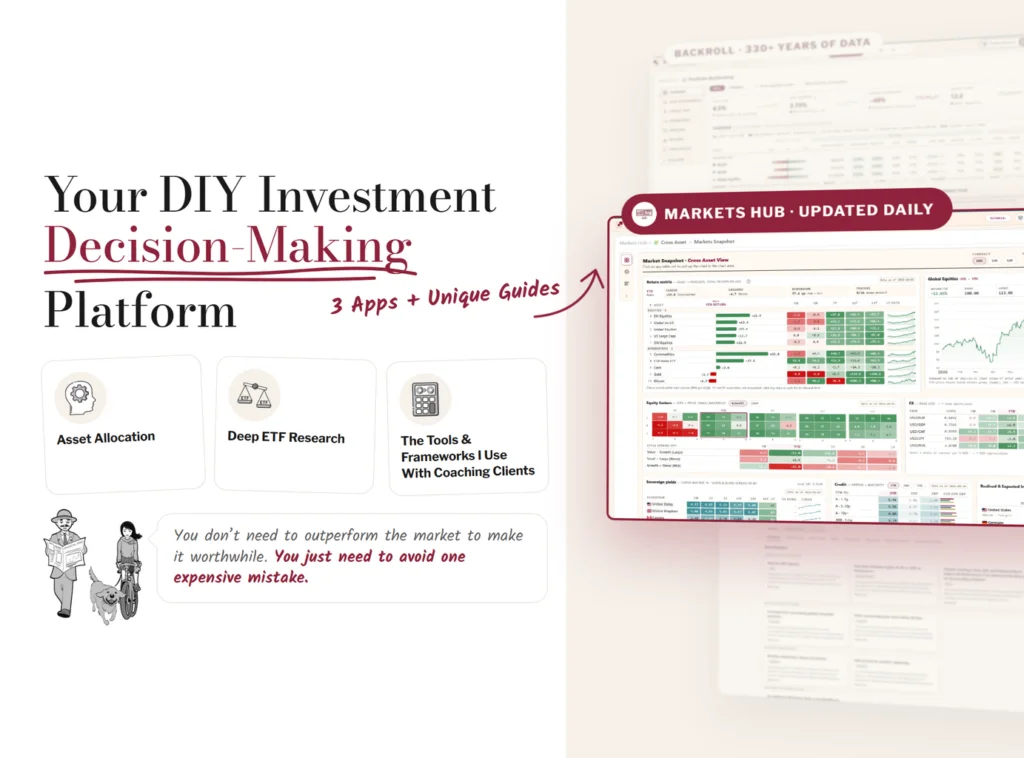
Markets Hub offers two modes. Golden Retriever strips away many advanced features to make the key information easier to scan. Banker mode opens the full set of panels, including fixed-income screens and the UCITS ETF market. A tutorial button walks users through the screen they’re viewing.
The demo’s planning assumptions draw on asset-manager estimates for ten-year returns. Users can view figures in US dollars, euros or pounds, choose a 10-, 20- or 30-year horizon, and compare nominal with inflation-adjusted returns. These estimates are presented as a starting case for retirement or family goals, not as a forecast. The figures are intended to feed into a Portfolio & Wealth Tracker that is in development for 2027/28; the demo says that tool will be a separate add-on and included with Lifetime.
A Market Snapshot puts several indicators together: equities and equity factors, currencies, sovereign yields inside and outside the eurozone, credit, and realised and expected inflation. A Performance Quilt adds historical context by ranking calendar-year returns for asset classes since 2010, or across the latest ten years. Investors can follow one category, such as emerging markets, and see how its results compare with other asset classes over time.
The equity screen uses the FTSE All-World ETF as a benchmark. For the period before that fund existed, the series is linked to the BackRoll Global Equities index. The demo says Vanguard’s FTSE Global All Cap will be added when vendor data becomes available. The panel also compares current results with long-run era averages, shows the index breakdown and factor-style matrix, and displays regional equity shares since 1900.
Bond yields, fund screens and planned payments
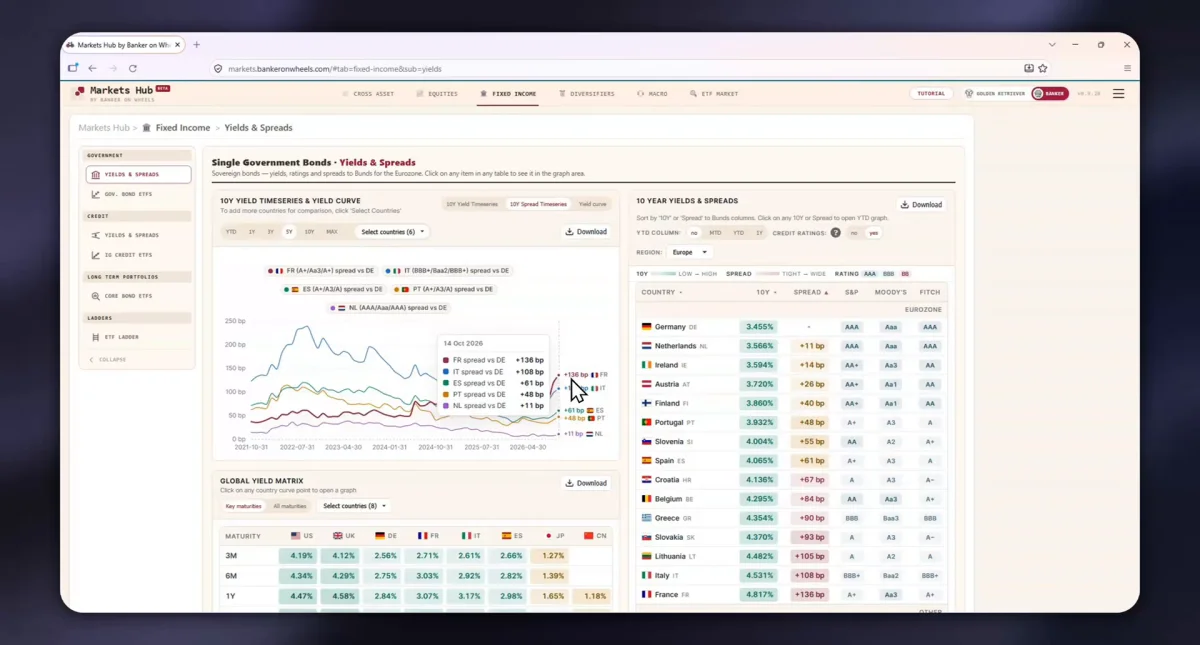
Fixed income has its own group of screens, covering government and corporate bonds, long-term portfolios and bond ladders. For the eurozone, the demo shows spreads over German Bunds, country yield curves alongside their levels five years earlier, credit ratings and a Global Yield Matrix. The accompanying screen lists 10-year spreads over Bunds and ratings, giving investors a way to compare yield differences across markets.
Bond ETF screens cover government, investment-grade and core, or aggregate, funds. They let users compare duration, yield to maturity, costs and drawdowns across reference funds from iShares and Vanguard. Users can choose a fund from another provider. One drawdown example illustrates how currency hedging and positive hedge carry can affect returns for a dollar investor in an aggregate bond fund. These screens track market segments; they aren’t presented as a fund-picking service. Separate guides cover ETF selection and currency hedging.
The ETF Ladder tool is built around known cash needs in the short to medium term. Users can choose from more than 100 fixed-maturity bond ETFs, enter a payment budget, or work backwards from a target payment to estimate the amount needed today. In the demo, a €10,000 payment due a couple of months later requires €9,964.59 upfront. A 2030 payment of the same amount requires €8,525.48 today, with the investment projected to compound to €10,000. A five-rung example targeting €10,000 a year from 2026 through 2030 shows €45,930 invested today and projected payments totalling €50,008 if held to maturity.

Gold, inflation and market context
The gold panel compares a model with the spot price. It shows real yields as an important historical driver until shortly after Covid, when the relationship weakened and inflation took a larger role. Central-bank buying, including purchases that aren’t disclosed, can’t be fully captured by the model, so the fit varies by period. For October 2026, the demo gives a spot price of $4,171 and model fair value of $4,235. Those are model outputs, not a promise that the prices will converge.
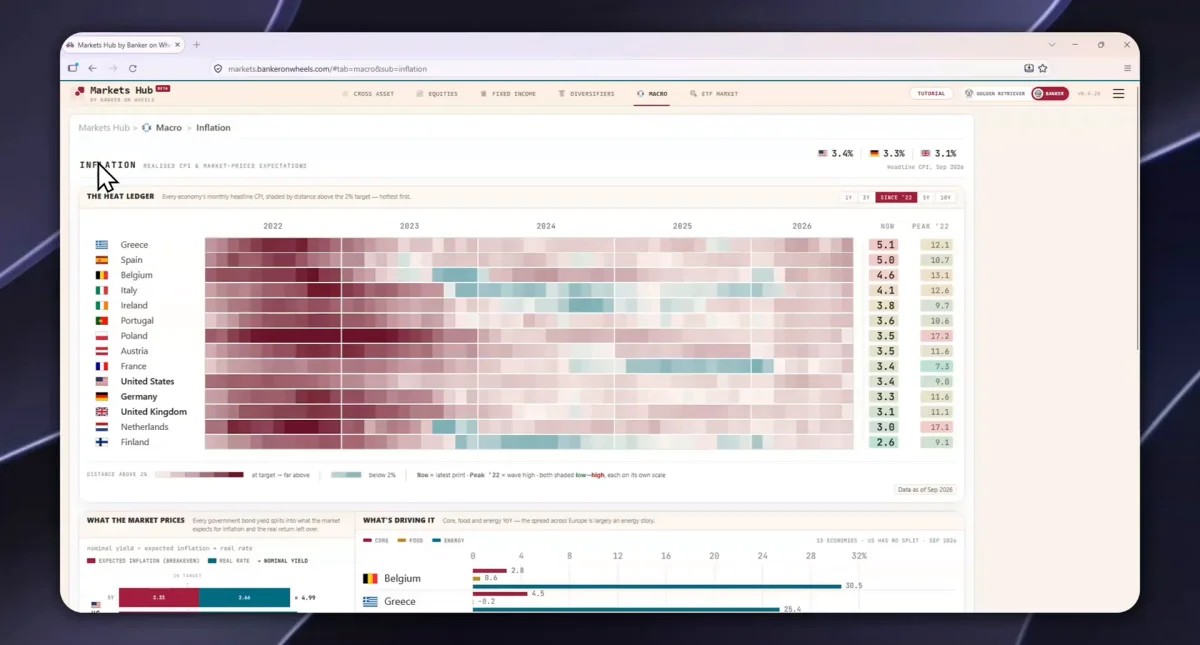
The inflation screens pair a Heat Ledger of realised inflation across European countries and the US with market pricing for future inflation. Market pricing isn’t a pure measure of inflation expectations, so it’s best treated as one planning input. A final view breaks inflation into core, food and energy. The September 2026 Heat Ledger shows 14 economies against their 2022 peaks: Germany at 3.3% compared with 11.6% at its peak, the United Kingdom at 3.1% compared with 11.1%, and the United States at 3.4% compared with 9.0%.
The demo also includes a snapshot of the UCITS ETF market. As of 9 October 2026, it lists €3,469 billion across 6,836 ETFs, €10.6 billion of net inflows that week, a 39.7% share of assets for iShares, and 456 new listings over 43 weeks. It also breaks down the market by issuer, sector, asset class and geography, and displays the launch pipeline.
What the monitor can and can’t tell you
Markets Hub is aimed at people investing outside the US who plan in years rather than days. It can help frame questions such as how current yields compare across bond markets, how hedging affects returns, or what investment might be needed for a payment in 2030. It won’t tell you tomorrow’s price, and its long-term assumptions remain estimates rather than guarantees.
Some panels are hidden in Golden Retriever mode, so users looking for fixed-income detail or UCITS ETF market data need Banker mode. The product is described as a set of premium market monitors, with data from several financial data vendors, including Finaeon (Global Financial Data), updated daily. The presale runs until 15 November 2026, with access from 16 November as part of Premium Research. The practical value is in checking a plan periodically against observable market conditions, then returning to the goals the plan is meant to fund.